News · New Launches
Singapore Q3 Private Home Prices Rise 1.4%, Rents Up 1.3%: Which Segments Lead?
Singapore’s private residential market recorded stronger price and rental growth but fewer transactions in the third quarter of 2026.
According to quarterly statistics released by the Urban Redevelopment Authority (URA) on 23 October, private residential prices, excluding executive condominiums (ECs), rose 1.4% quarter on quarter, up from 0.5% in Q2. Private residential rents increased 1.3%, compared with 0.7% in the previous quarter.
However, a rise in the overall index does not mean every project is accelerating. Significant differences remain between regions, housing types and the mix of transactions.
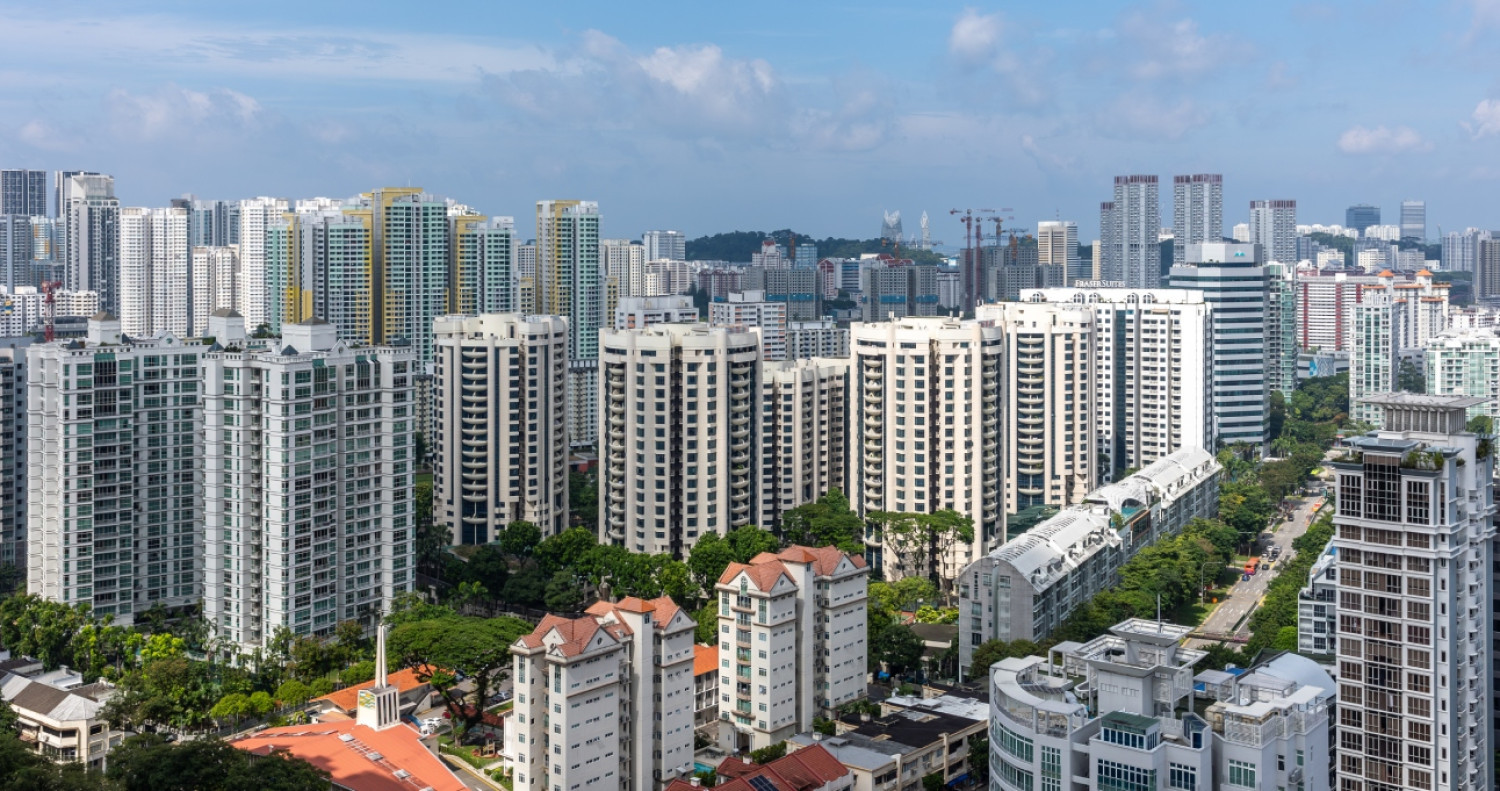
Landed Homes Lead, Suburban Condominiums Stand Out
Over the first three quarters of 2026, Singapore’s overall private residential price index rose by an average of approximately 0.9% per quarter, similar to the same period last year.
Landed home prices rose 2.9% in Q3, compared with 2.5% in Q2, contributing significantly to the overall increase.
Non-landed private residential prices reversed a 0.1% decline in Q2 to increase 1.0% in Q3.
Non-landed price changes by region:
| Region | Q3 Price Change, Quarter on Quarter |
|---|---|
| Outside Central Region (OCR, suburbs) | Up 2.3% |
| Core Central Region (CCR) | Up 0.3% |
| Rest of Central Region (RCR, city fringe) | Unchanged |
The suburbs posted the strongest growth. CCR growth slowed from 1.8% in the previous quarter to 0.3%, while RCR prices stabilised after falling 1.2% in Q2.
The Transaction Mix Also Matters
New launches were relatively quiet in Q3, but higher-priced units accounted for a larger share of new home transactions.
According to SRI, new private homes priced from S$2 million to below S$5 million made up 68.2% of Q3 new home sales, significantly above 49.2% in Q2.
This does not necessarily indicate that buyers are less price-sensitive; it may also reflect the projects and unit types available during the quarter.
The stronger price index should therefore be interpreted alongside the transaction mix and individual market segments, rather than as a blanket increase in prices across all projects.
Transactions Fall 16.3%; Resales Gain Market Share
In contrast to rising prices, total private residential transactions fell 16.3% quarter on quarter to 5,146 units, the lowest since Q2 2025.
Analysts attributed slower sales to fewer new launches and seasonal changes in buying activity.
Resale transactions edged down from 3,813 in Q2 to 3,801 in Q3. With fewer overall transactions, resales’ share rose from 62% to 73.9%.
Suburban condominiums accounted for 52.4% of resale transactions, indicating that owner-occupiers remain an important source of demand.
Among lodged condominium resale transactions, active projects included:
| Project | Q3 Resale Transactions |
|---|---|
| Riverfront Residences | 33 units |
| D’Nest | 29 units |
| Normanton Park | 27 units |
| Treasure at Tampines | 27 units |
With demand easing slightly, some buyers secured greater room for negotiation. Resale market prices declined by approximately 1.1% in Q3.
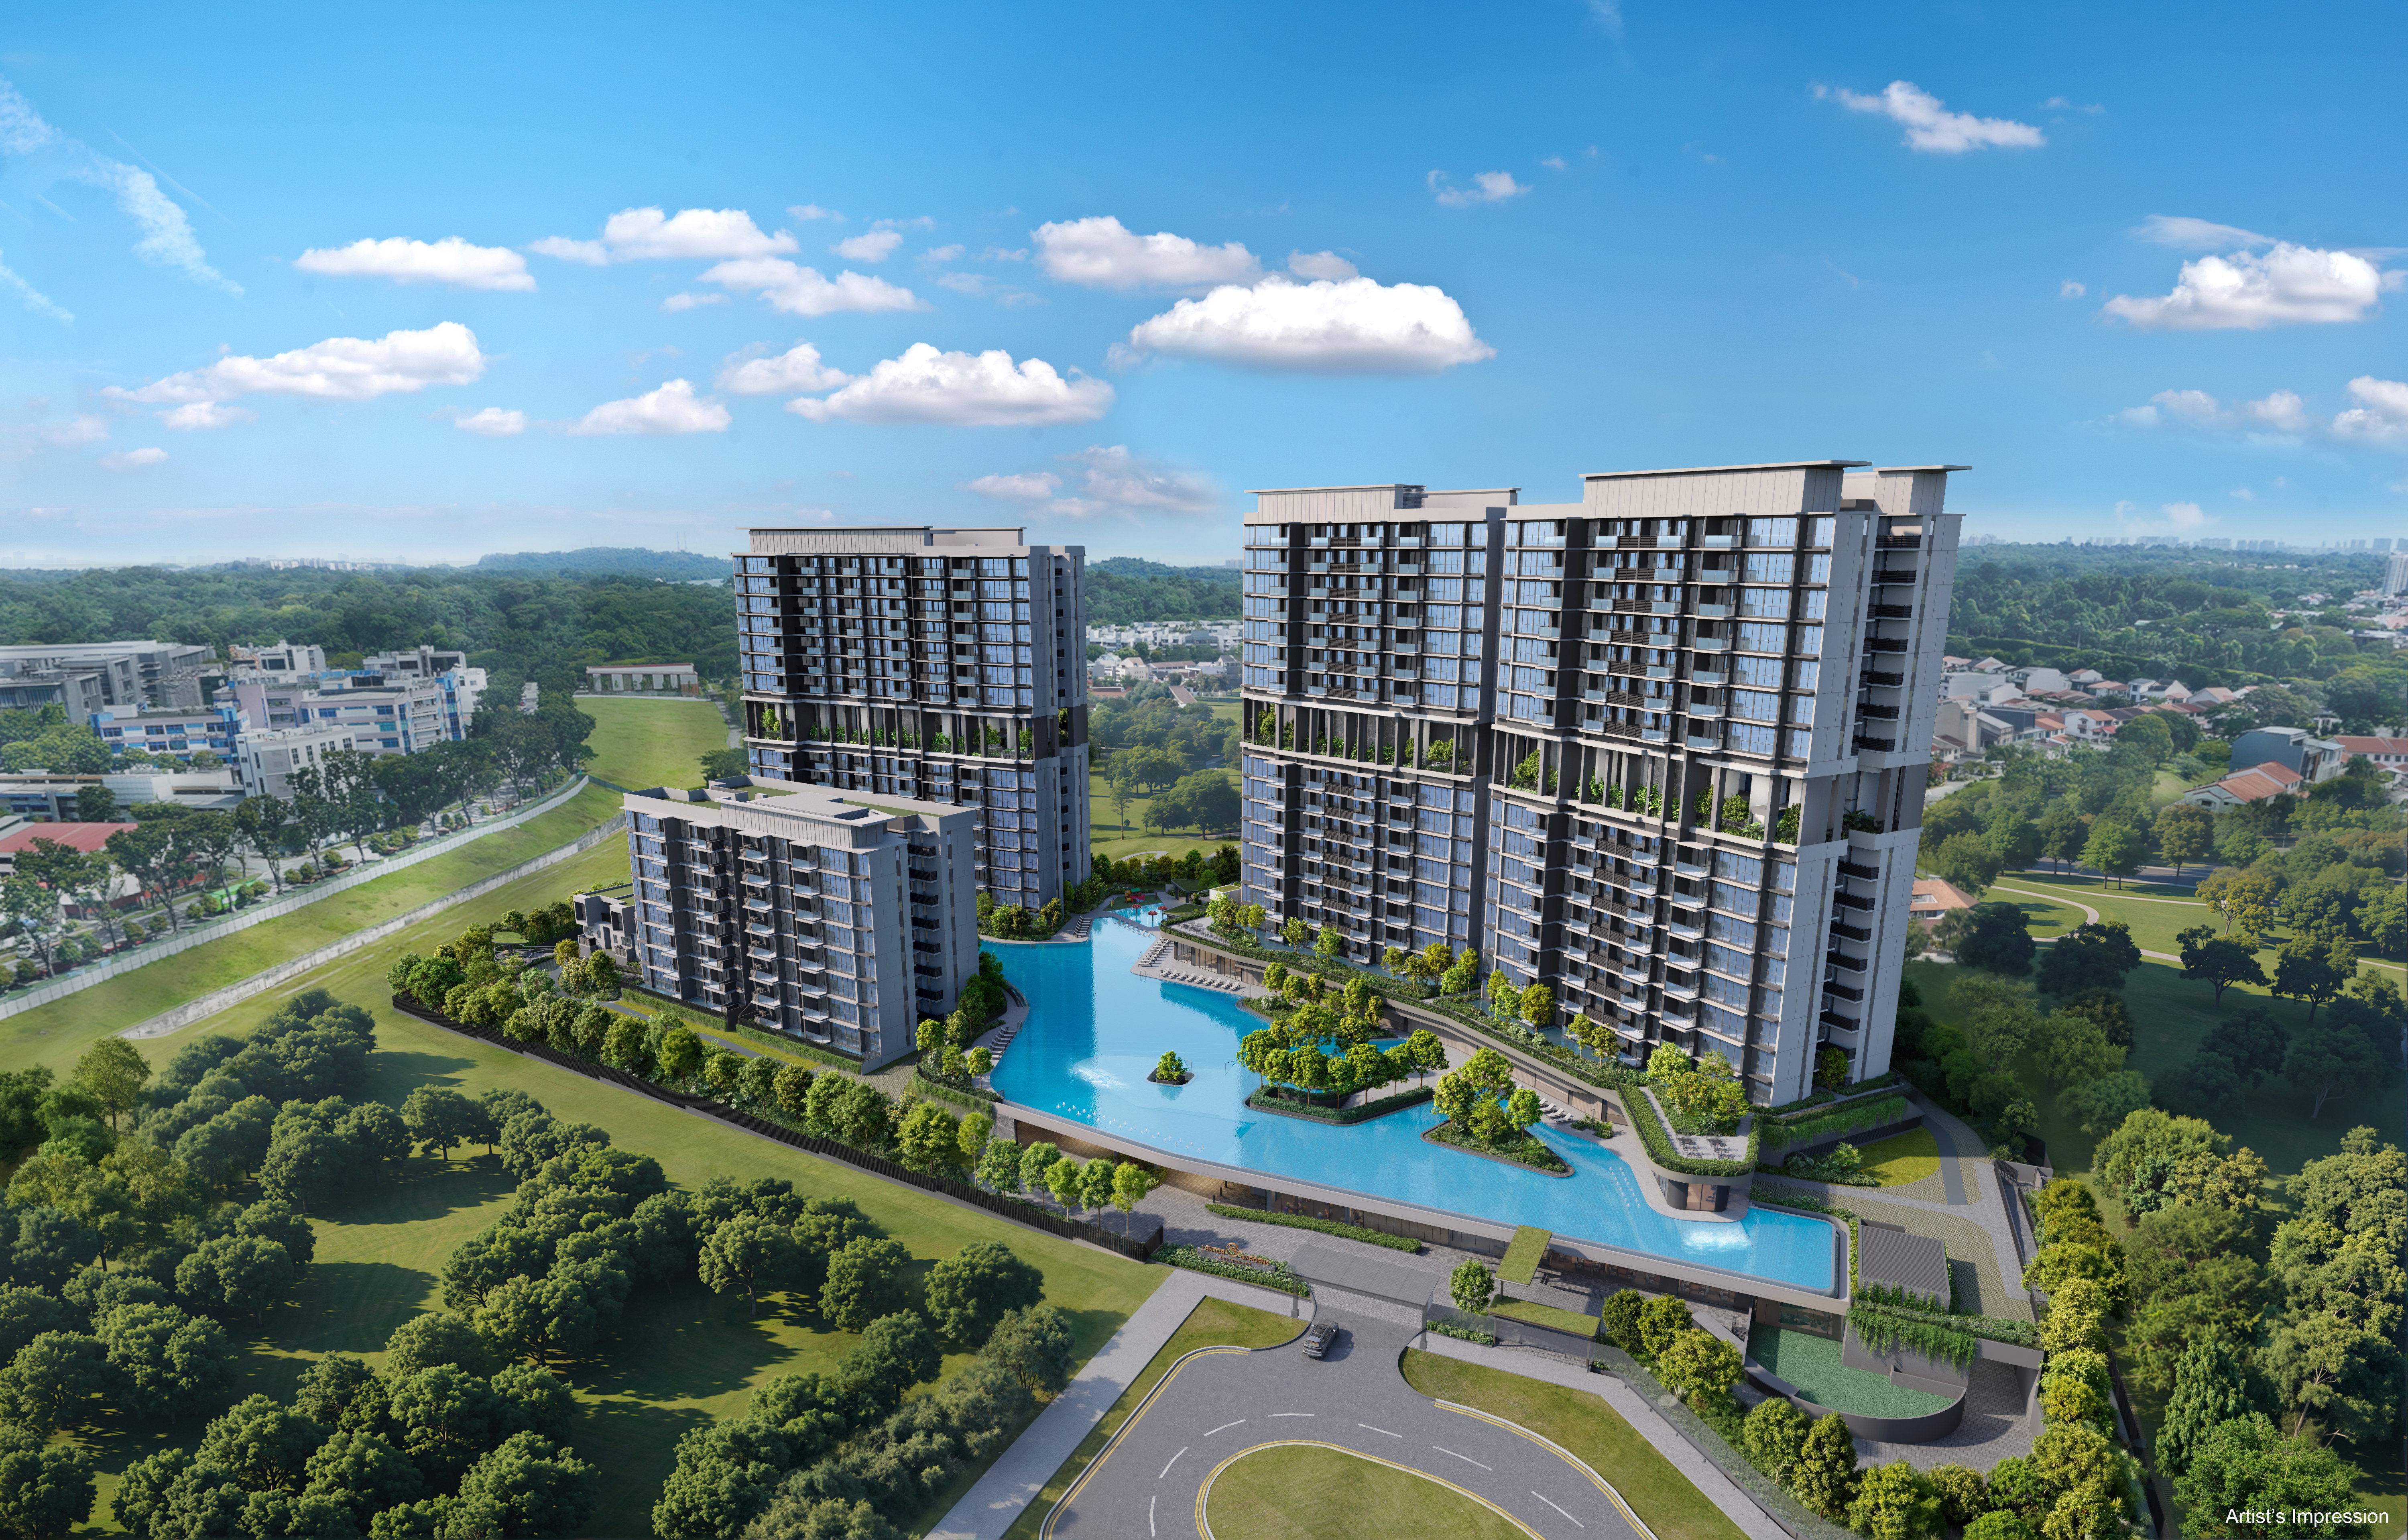
Among new launches, Lentor Gardens Residences was the quarter’s best-selling project. The report linked its performance to development in the Lentor area, the completion of Lentor Mall, project pricing and the area’s investment appeal.
588 Landed Home Transactions: A Quarterly High for 2026
Despite quieter overall private home trading, landed homes remained relatively active.
There were 588 landed home transactions in Q3, the highest quarterly volume of 2026.
The number of homes sold for S$5 million or more rose to 308. Transactions priced between S$5 million and S$7.5 million represented approximately 40.4% of all landed transactions, the largest price band.
The increase in higher-value transactions was also a factor behind the rise in the landed home price index.
EC Median Price per Square Foot Falls; Unsold Stock Below 150 Units
The executive condominium market followed a different trend.
According to Huttons, policy tightening in May 2026 prompted some buyers to choose available EC units rather than wait for future launches.
Developers sold 68 units in existing EC projects in Q3, including:
- Coastal Cabana: 49 units, with a median price of S$1,829 per square foot;
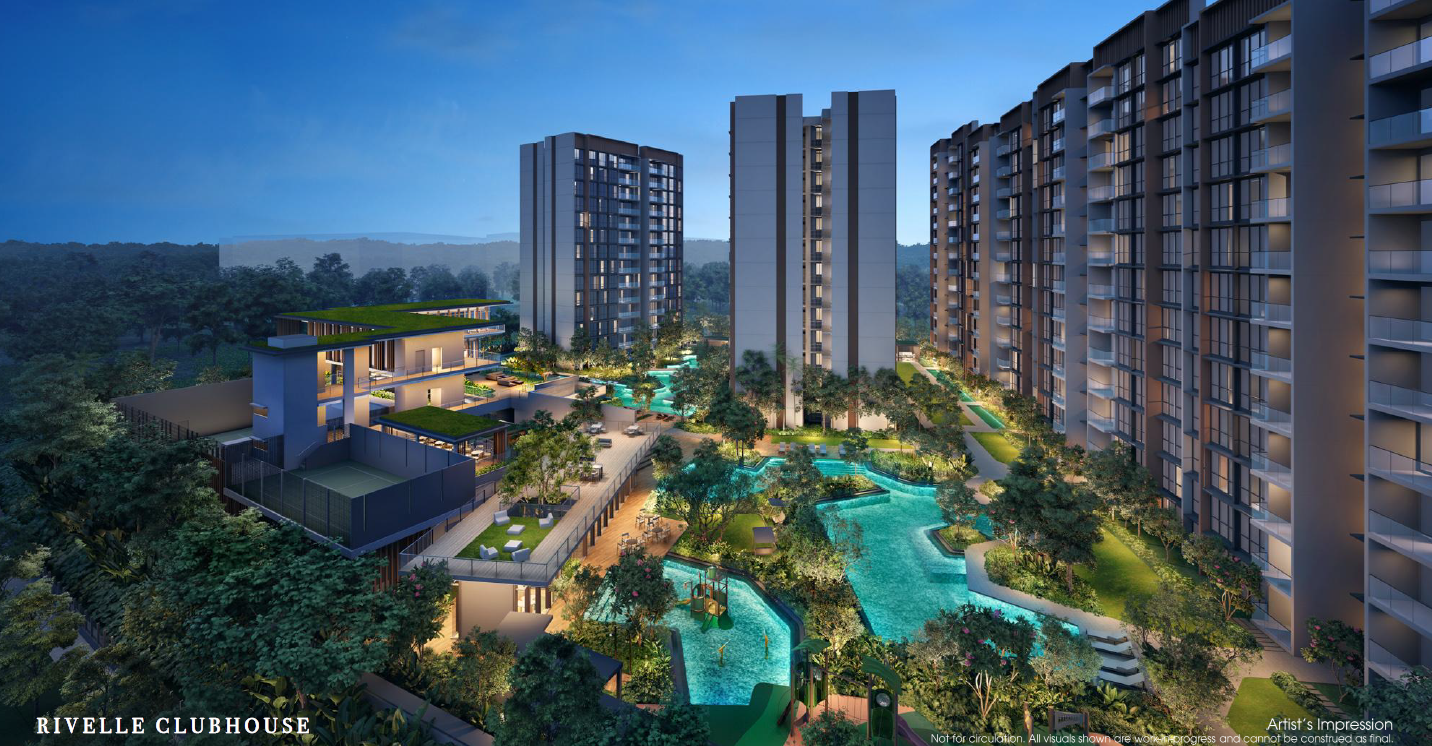
- Rivelle Tampines: 18 units, with a median price of S$1,938 per square foot.
Overall, the median EC transaction price fell from S$1,880 per square foot in Q2 to S$1,850 in Q3, a quarter-on-quarter decline of 1.6%.
As at the end of September 2026, fewer than 150 EC units remained unsold.
Rents Rise Overall, with Suburban Condominiums Leading
Private residential rents increased 1.3% in Q3, compared with 0.7% in the preceding quarter.
- Landed home rents rose 2.1%, slowing slightly from 2.7% in Q2;
- Non-landed home rents rose 1.2%, up from 0.4% in Q2.
Regional differences in non-landed rents were pronounced:
| Region | Q2 Rental Change | Q3 Rental Change |
|---|---|---|
| OCR (suburbs) | Down 0.3% | Up 3.1% |
| RCR (city fringe) | Unchanged | Up 1.5% |
| CCR | Up 1.2% | Down 0.3% |
The suburbs led both condominium price and rental growth, while CCR rents reversed from growth to decline.
Meanwhile, private residential stock increased by a net 3,491 units in Q3. The overall vacancy rate rose from 6.4% to 7.2%, corresponding to an occupancy rate of 92.8%.
Overall occupancy remained healthy, but changes in employment patterns and tenant demand mean landlords should pay closer attention to tenants’ budgets, household structures and housing preferences.
Approximately 32,800 Homes Available for Sale in the Next One to Two Years
URA stated that approximately 32,800 private residential units, including ECs, are expected to be available for sale over the next one to two years.
These form part of approximately 57,200 private residential units expected to be completed over the coming years.
The Government Land Sales programme is also increasing supply. Confirmed List sites in the second half of 2026 are expected to provide 4,745 private homes, taking the full-year Confirmed List supply to 9,320 units, over 50% above the annual average of the past decade.
Homes available for sale, potential supply from land sales and completed units represent different stages and should not simply be added together.
Major Q4 Launches Could Lift Transactions
New home transactions are expected to become more active in Q4 as several major projects launch. Projects attracting market attention include:
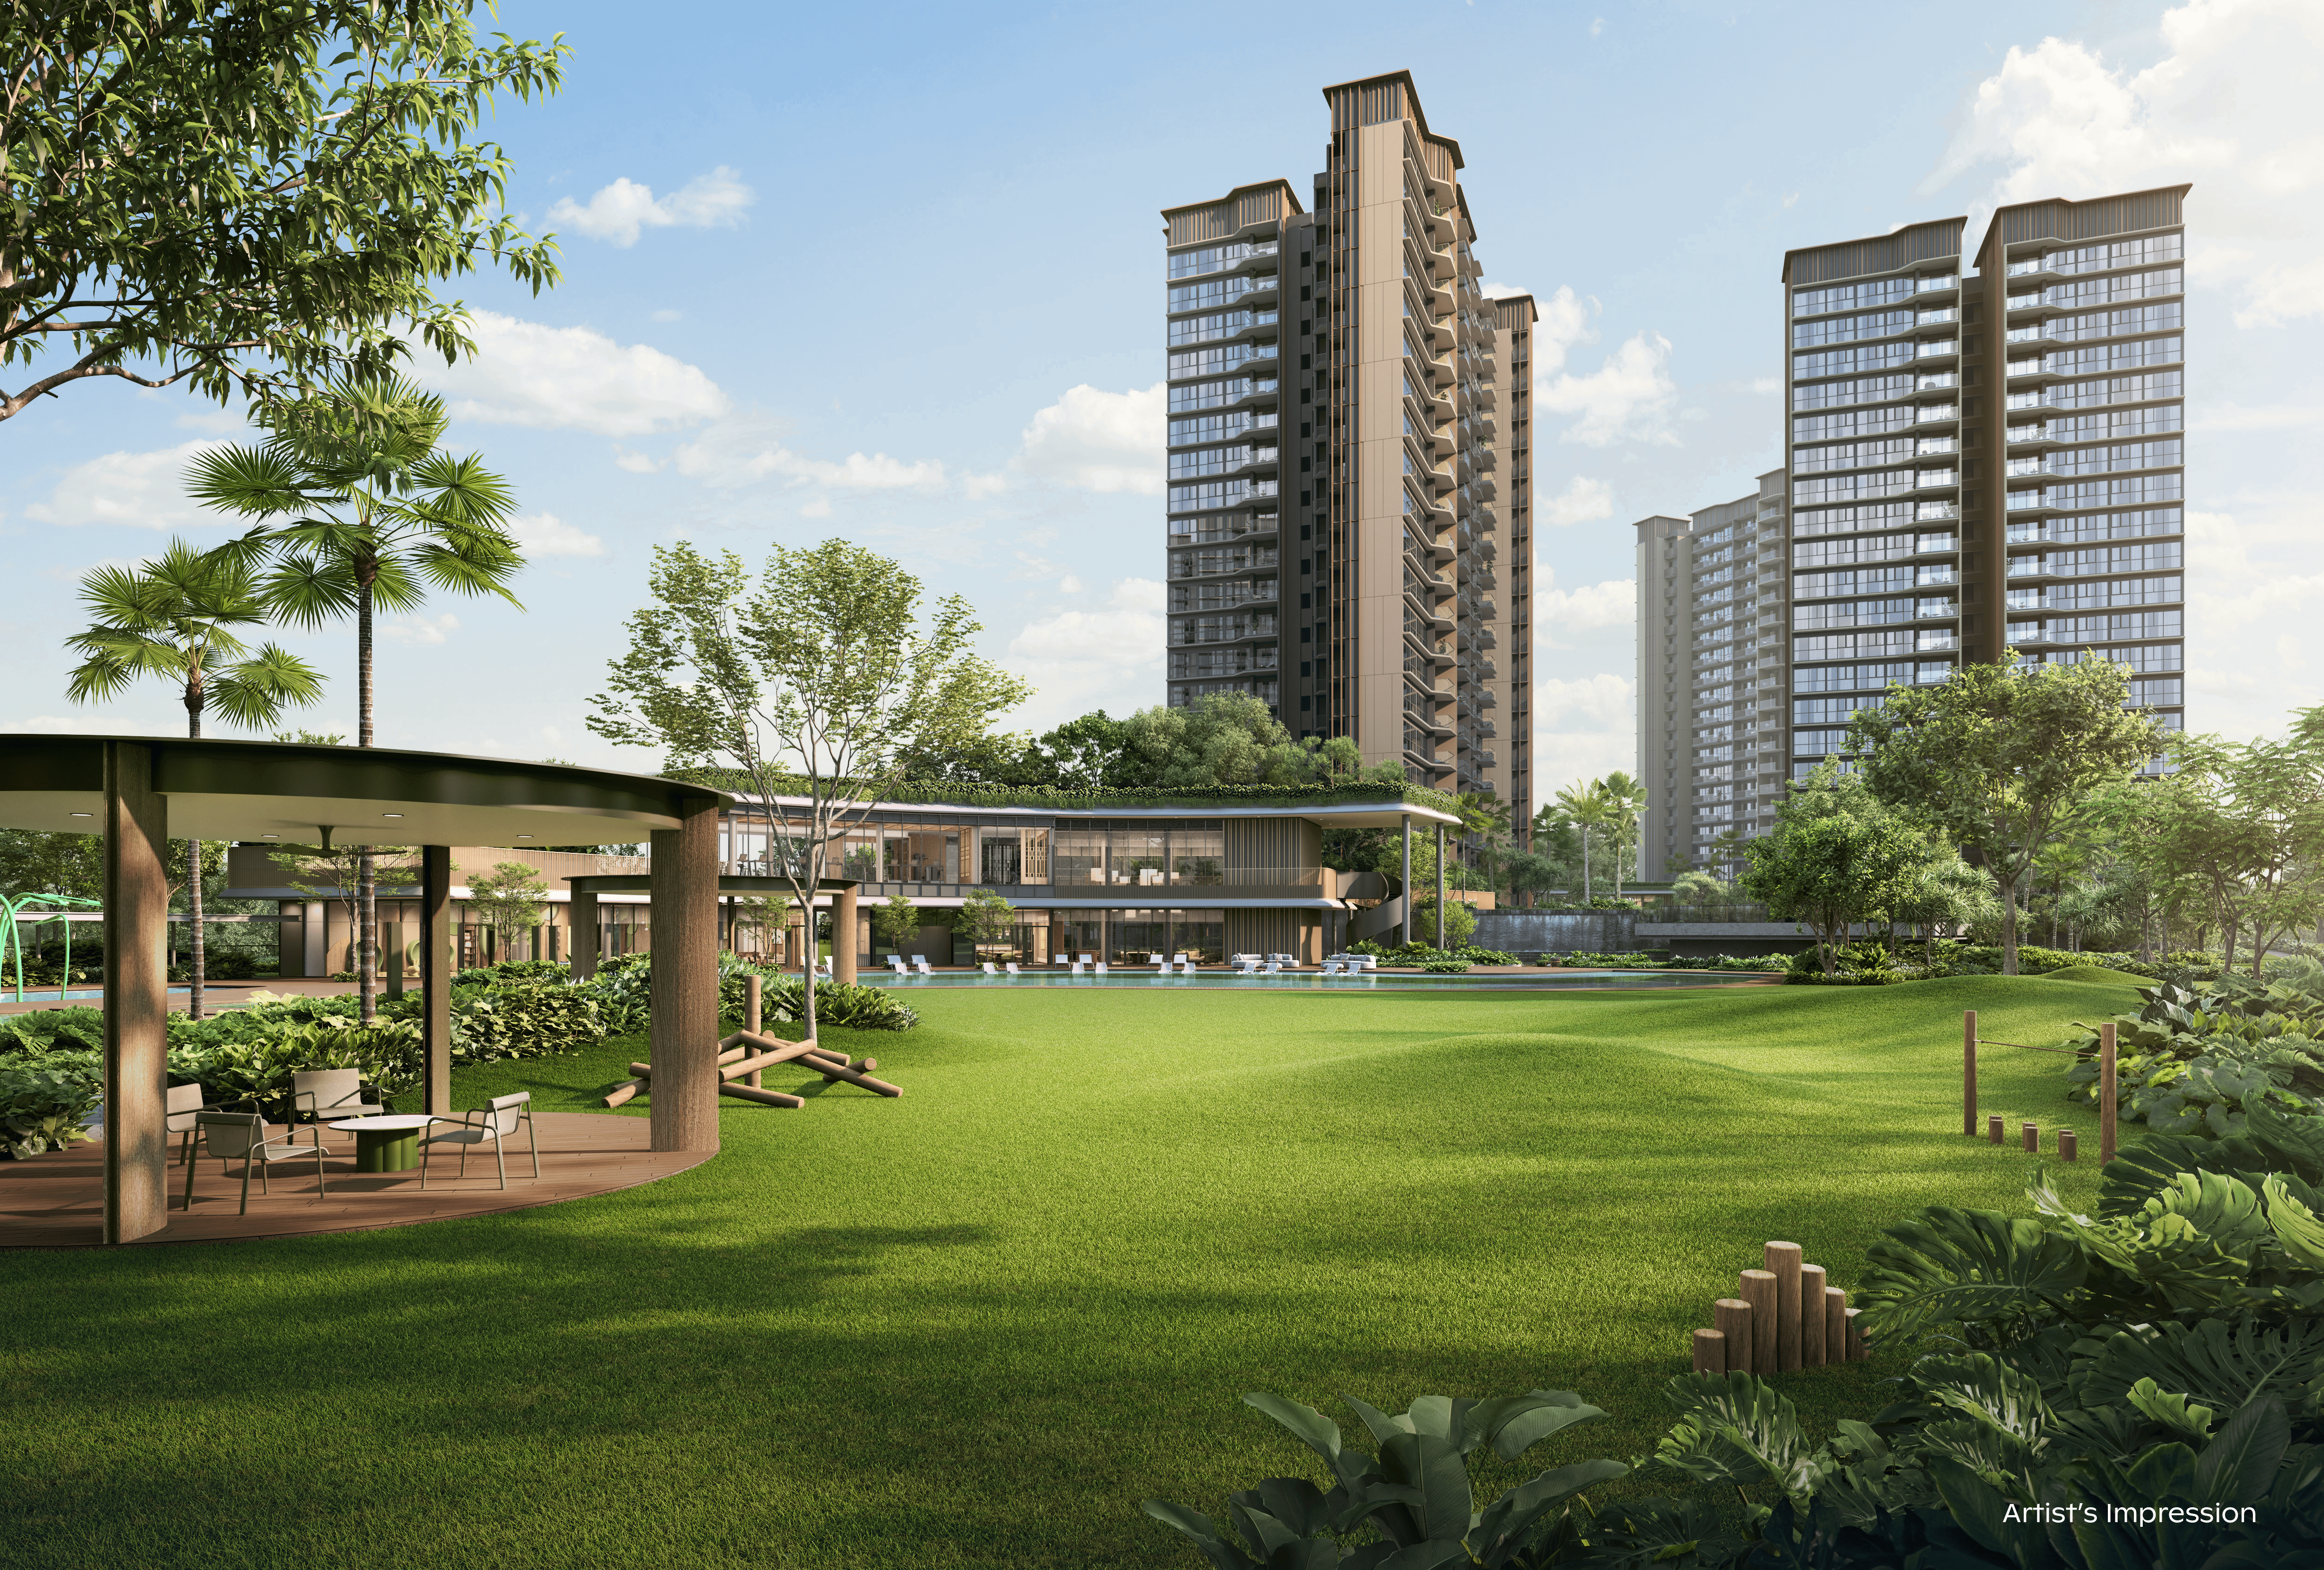
Thomson Reserve, located in the city fringe, comprises 1,268 homes. The report noted that if its average launch price exceeds S$2,600 per square foot, these transactions could exert upward pressure on the overall Q4 private residential price index.
Financing costs remain an important consideration in buyers’ budgets. Market commentary in the report also cautioned that if interest rates continue to rise over the coming months, some buyers may take a more prudent approach.
Q3 data paints a differentiated market: landed homes and suburban condominiums recorded stronger price growth, resales still offered negotiation opportunities, and rental performance varied by region. Buyers can use the overall index to monitor trends, but individual decisions should ultimately reflect project prices, unit types, supply and their own budgets.
Projects in this article
OCR · Outside Central
Lentor Gardens Residences
District 26 | Mandai / Upper Thomson
Prices from $1,558,100
OCR · Outside Central
Rivelle Tampines
District 18 | Pasir Ris / Tampines
Price from $1,937,000
OCR · Outside Central
Lucerne Grand
District 22 | Boon Lay / Jurong / Tuas
Contact Developer Appointed Sales Team for Latest Prices
OCR · Outside Central
Thomson Reserve
District 20 | Ang Mo Kio / Bishan / Thomson
Price: Contact us for latest prices
CCR · Core Central
The Serra Residences
District 11 | Newton / Novena
Contact Developer Appointed Sales Team for the Latest Prices