News
Government Land Sales Are Getting More Expensive: Who Is Really Driving Up Land Prices?
From $833 to $1,312 psf ppr: How Much Have Singapore Residential Land Prices Climbed in 10 Years?
Singapore residential land prices have charted an overall upward trajectory over the past decade.
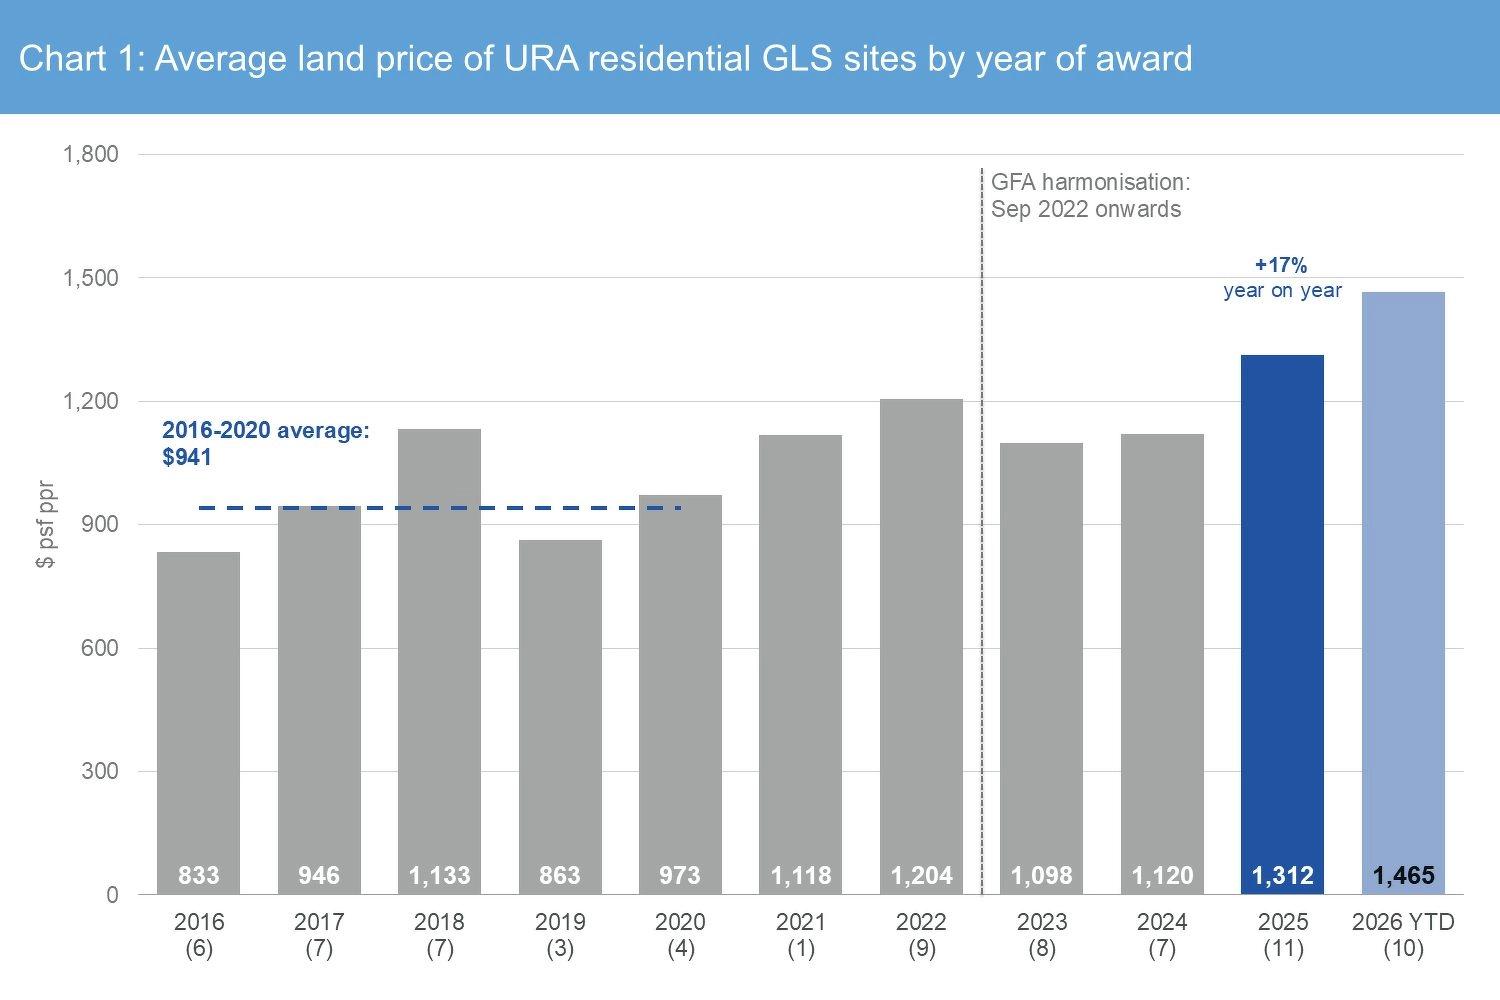
Based on an analysis of 63 residential Government Land Sales (GLS) sites awarded between 2016 and 2025, average land rates rose from $833 per square foot per plot ratio (psf ppr) to $1,312 psf ppr. This represents a cumulative increase of approximately 57.5%, or an annualised growth of around 5%.
In September this year, the Lorong Puntong / Sin Ming Avenue site was awarded for $208.1 million, setting a new benchmark land rate for the Rest of Central Region (RCR) at $1,612 psf ppr. This surpassed the previous record set just a month earlier in August by the Berlayar Drive site at $1,515 psf ppr.
However, land price growth did not occur at a uniform pace each year, nor can it simply be attributed to developers bidding more aggressively.
A Decade of Gains Interspersed with Volatility
Between 2016 and 2020, the average land price for residential GLS sites stood at around $941 psf ppr.
From 2021 to 2024, average levels held largely between $1,100 and $1,200 psf ppr. By 2025, the average land rate had climbed to $1,312 psf ppr, marking a year-on-year increase of about 17%.
Individual high-priced sites can also skew the average for any given year.
For instance, the average land price hit $1,133 psf ppr in 2018, partially driven by the Cuscaden Road site that fetched $2,377 psf ppr (subsequently developed as Cuscaden Reserve). Excluding this prime parcel, the average land price for that year would have been around $1,001 psf ppr, aligning much more closely with other years.
A Dip in Headline Land Prices Doesn't Necessarily Mean Lower Costs
When assessing price movements between 2023 and 2024, changes to floor area harmonisation rules must also be taken into account.
The harmonisation of gross floor area (GFA) definitions across government agencies took effect for GLS sites launched from 1 September 2022 onwards.
Under the revised definition, air-conditioner ledges are included in GFA, while void spaces can no longer be counted towards saleable area. In essence, this reduces the net saleable area that can be generated from every square foot of GFA.
Consequently, even if a site commands the exact same headline psf ppr, a developer's effective land cost per square foot of saleable area could be higher than before.
This fundamental adjustment in calculations cannot be overlooked when comparing historical and newer GLS plot prices.
Fewer Bidders, Yet Land Prices Still Rise: Why?
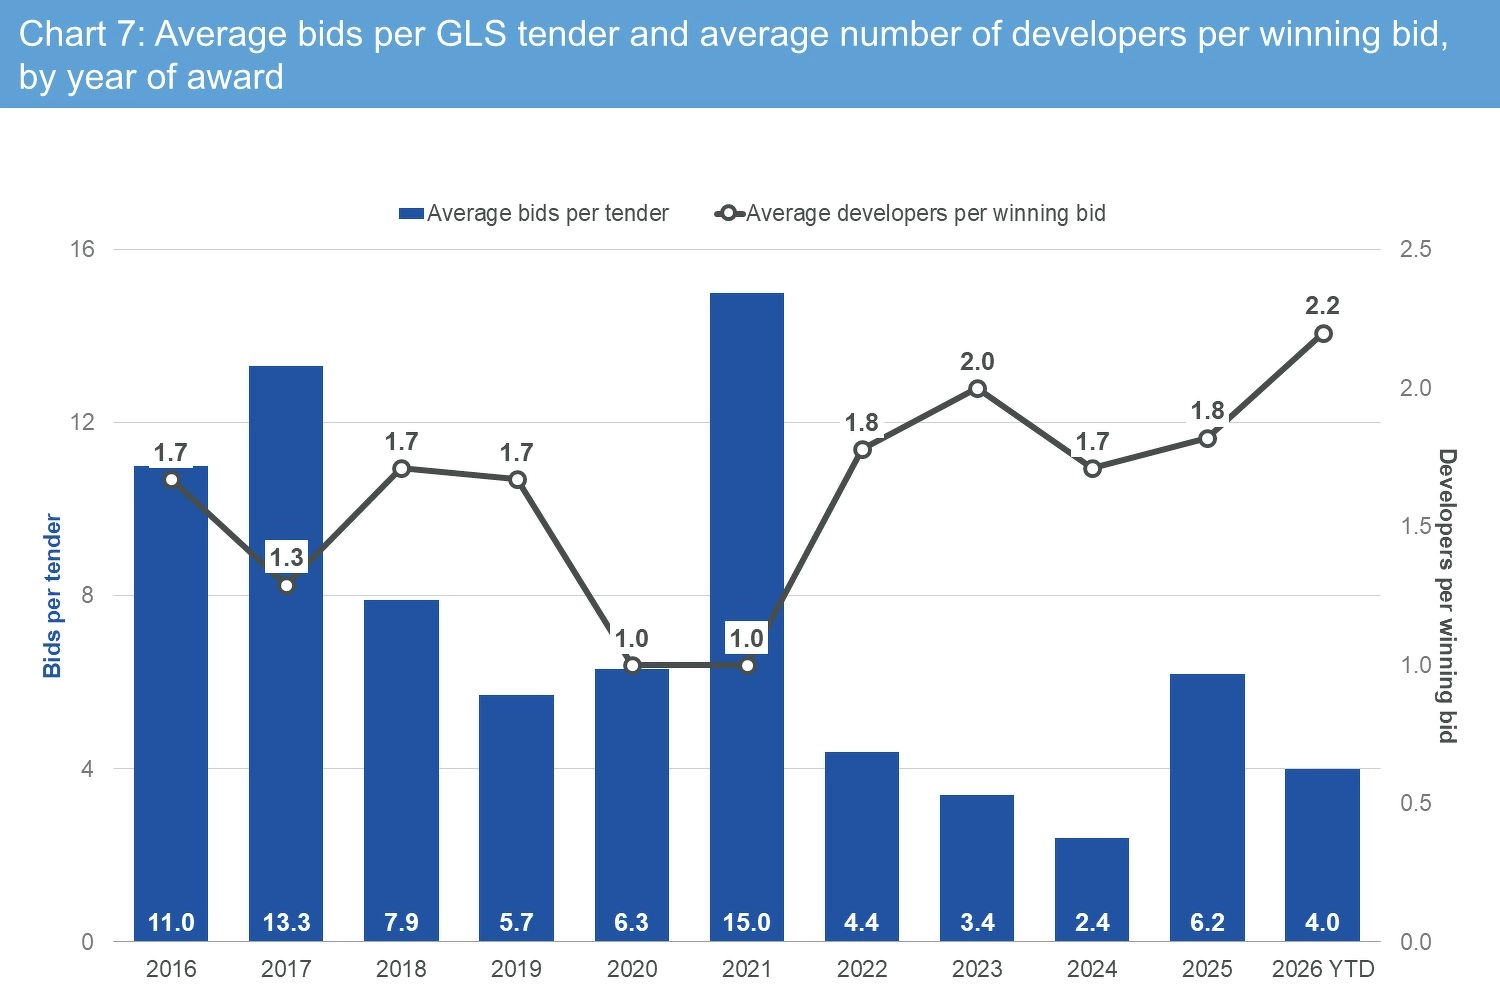
Over the past decade, the average number of bids submitted per GLS tender has actually declined.
Between 2016 and 2018, tenders drew an annual average of 7.9 to 13.3 bids per parcel; since 2022, that average has not exceeded 6.2 bids.
One key reason is that developers are increasingly forming joint ventures to tender for sites, spreading their capital outlays and risk exposure for larger-scale developments.
Year to date at the time of writing, winning consortiums comprised an average of 2.2 developers—the highest level since 2016. However, analysis indicates that consortiums have not consistently outbid solo developers within the same year and market segment.
In other words, escalating land prices are not necessarily driven by "more developers fighting over the same plot".
Selling Price Expectations and Land Replenishment Matter More
The price a developer is willing to bid is ultimately anchored by future end-sale price expectations and the urgency to replenish their land bank.
Over the past decade, rising new private home prices, thinning unsold inventory, and a subdued collective sale (en bloc) market have collectively supported higher bids on GLS tenders.
Understanding land rates requires looking beyond the number of bidders at tender close; it hinges equally on developers' projections of future home sales and the availability of alternative land supply in the market.
This article is based on an analysis of residential GLS tender data from 2016 to 2025; 2026 data reflects figures up to the time of reporting. All land rates refer to price per square foot per plot ratio (psf ppr), not residential unit selling prices.